① Kishimoto H, Yamada S, Kanahashi T, Yoneyama A, Imai H, Matsuda T, Takeda T, Kawai K, Three-dimensional observation of palatal muscles in the human embryo and fetus: development of levator veli palatini and clinical importance of the lesser palatine nerve, Developmental Dynamics 245: 123–131, 2016, DOI: 10.1002/dvdy.24382, DOI: 10.1002/dvdy.24364
19. Ueda Y, Yamada S, Uwabe C, Kose K, Takakuwa T, Intestinal rotation and physiological umbilical herniation during the embryonic period, Anatomical Record 299, 197-206, 2016, DOI: 10.1002/ar.23296
ABSTRACT
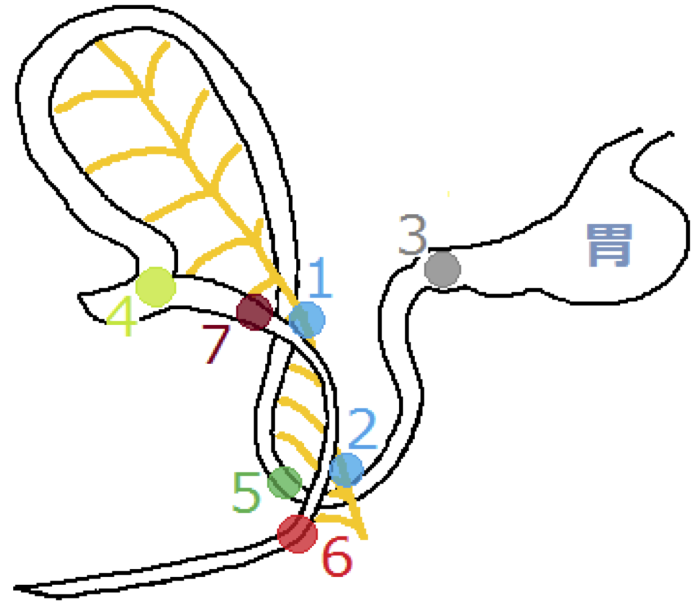
Drastic changes occur during the formation of the intestinal loop (IL), including elongation, physiological umbilical herniation (PUH), and midgut rotation. Fifty-four sets of magnetic resonance images of embryos between Carnegie stage (CS) 14 and CS 23 were used to reconstruct embryonic digestive tract in three dimensions in the Amira program. Elongation, PUH, and rotation were quantified in relation to the proximal part of the superior mesenteric artery (SMA), designated as the origin. Up to CS 16, IL rotation was initially observed as a slight deviation of the duodenum and colorectum from the median plane. The PUH was noticeable after CS 17. At CS 18, the IL showed a hairpin-like structure, with the SMA running parallel to the straight part and the cecum located to the left. After CS 19, the IL began to form a complex structure as a result of the rapid growth of the small intestinal portion. By CS 20, the IL starting point had moved from the right cranial region to an area caudal to the origin, though elongation of the duodenum was not conspicuous—this was a change of almost 180° in position. The end of the IL remained in roughly the same place, to the left of and caudal to the origin. Notably, the IL rotated around the origin only during earlier stages and gradually moved away, running transversely after CS 19. The movements of the IL may be explained as the result of differential growth, suggesting that IL rotation is passive.
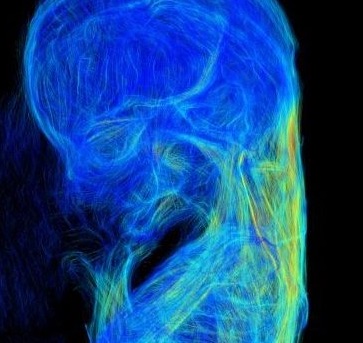
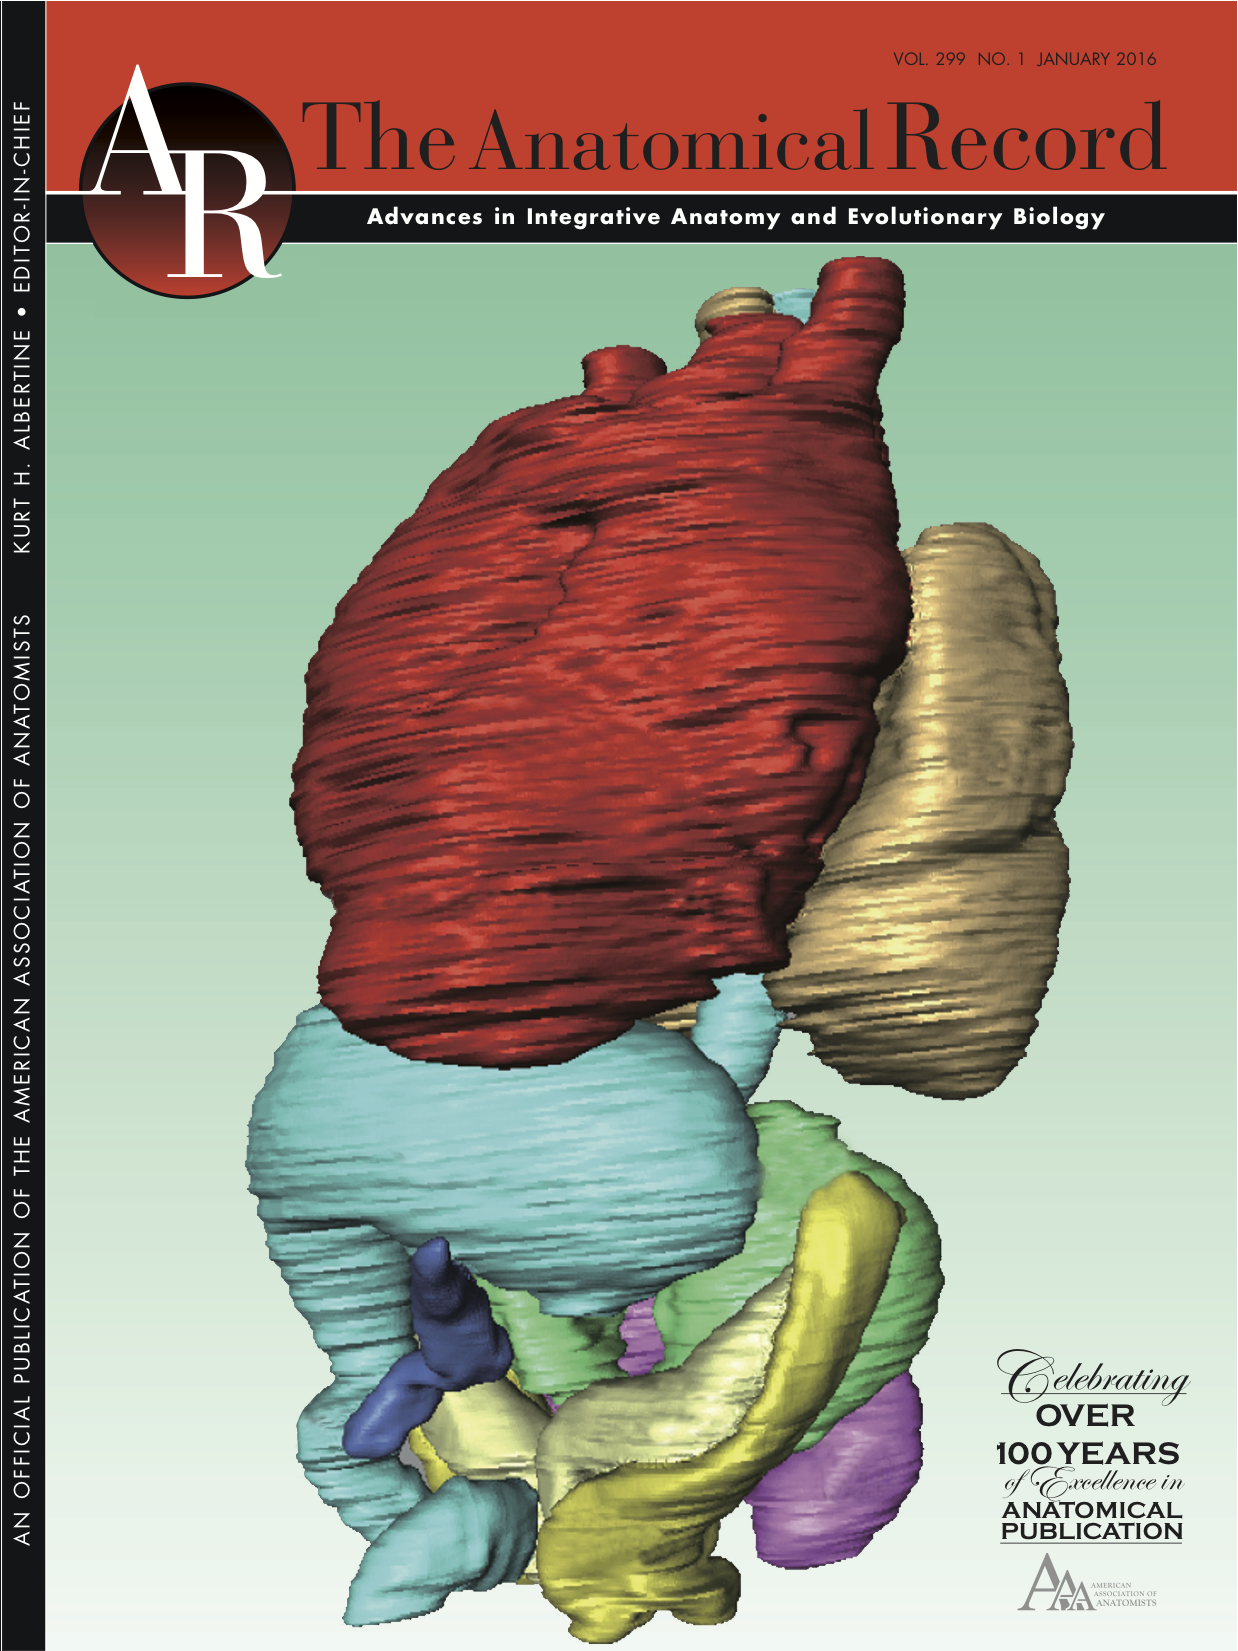
金橋くんの論文の図がAnatomical Record 299巻1号の表紙に採用されました。位相CTを用いて解析した肝臓のない個体です。同個体は胎児期に発生が進まなくなり流産すると考えられます。
金橋くんの論文は同号に掲載されました。
18. Kanahashi T, Yamada S, Tanaka M, Hirose A, Uwabe C, Kose K, Yoneyama A, Takeda T, Takakuwa T, A novel strategy to reveal the latent abnormalities in human embryonic stages from a large embryo collection, Anatomical Record, 299,8-24,2016 10.1002/ar.23281(概要),
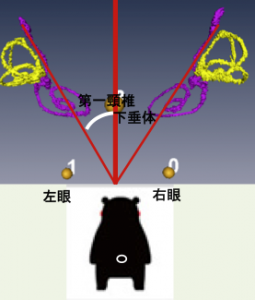
17. Toyoda S, Shiraki N, Yamada S, Uwabe C, Imai H, Matsuda T, Yoneyama A, Takeda T, Takakuwa T, Morphogenesis of the inner ear at different stages of normal human development. Anatomical Record, 298:2081–2090 (2015), doi: 10.1002/ar.23268
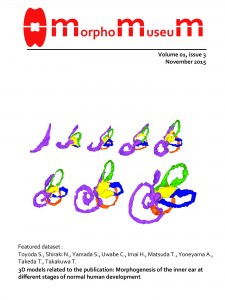
作成した立体データの代表的なものはMorphoMuseumに発表されました。
Toyoda S, Shiraki N, Yamada S, Uwabe C, Imai H, Matsuda T, Yoneyama A, Takeda T, Takakuwa T, Morphogenesis of the human inner ear membranous labyrinth. MorphoMuseuM 1 (3)-e6. doi: 10.18563/m3.1.3.e6
ABSTRACT
This study examined the external morphology and morphometry of the human embryonic inner ear membranous labyrinth and documented its three-dimensional position in the developing embryo using phase-contrast X-ray computed tomography and magnetic resonance imaging. A total of 27 samples between Carnegie stage (CS) 17 and the postembryonic phase during trimester 1 (approximately 6–10 weeks after fertilization) were included. The otic vesicle elongated along the dorso-ventral axis and differentiated into the end lymphatic appendage and cochlear duct (CD) at CS 17. The spiral course of the CD began at CS18, with anterior and posterior semicircular ducts (SDs) forming prominent circles with a common crus. The spiral course of the CD comprised more than two turns at the postembryonic phase, at which time the height of the CD was evident. A linear increase was observed in the length of anterior, posterior, and lateral SDs, in that order, and the length of the CD increased exponentially over the course of development. Bending in the medial direction was observed between the cochlear and vestibular parts from the latero-caudal view, with the angle decreasing during development. The position of the inner ear was stable throughout the period of observation on the lateral to ventral side of the rhombencephalon, caudal to the pontine flexure, and adjacent to the auditory ganglia. The plane of the lateral semicircular canal was approximately 8.0°–14.6° with respect to the cranial caudal (z-)axis, indicating that the orientation of the inner ear changes during growth to adulthood.
ヒトの発生学についての総説が発行されました。New Discoveries in Embryologyという書籍の第5章に収載されています。internetからdownloadできます。
Yamada S, Hill M, Takakuwa T, Chapter 5, Human Embryology, (Wu B, editor) New Discoveries in Embryology Open Access Publisher, Rijeka, Croatia, 2015, pp 97-124. ISBN 978-953-51-2182-4
18.Kanahashi T, Yamada S, Tanaka M, Hirose A, Uwabe C, Kose K, Yoneyama A, Takeda T, Takakuwa T, A novel strategy to reveal the latent abnormalities in human embryonic stages from a large embryo collection, Anatomical Record, 299,8-24,2016 10.1002/ar.23281(概要), *299(1),2016の表紙に採用されました。DOI: 10.1002/ar.23206 (cover page)
The cause of spontaneous abortion of normal conceptuses remains unknown in most cases. The study was aimed to reveal the latent abnormalities by using a large collection of embryo images from a magnetic resonance imaging (MRI) database and novel phase-contrast radiographic computed tomography (PXCT). MRI from 1,156 embryos between Carnegie stage (CS) 14 and CS23 from the Kyoto Collection were screened by using the volume of the liver as the target organ. Embryos with liver volumes ≥2 SD above or below the mean for the stage of development were screened and examined precisely on MRI. Embryos with potentially abnormal livers were further analyzed by using PXCT. Liver abnormality was detected in all 7 embryos in the extra-small liver group and in 2 of 8 embryos in the extra-large liver group. The abnormalities in the extra-small liver group consisted of hepatic agenesis (2 embryos), hepatic hypogenesis (4), and liver lobe defect (1). Among the 7 extra-small liver group, 2 had only liver abnormalities and 5 exhibited complications in other organs. Of the 2 embryos in the extra-large liver group, one had only a single liver abnormality and the other had a morphologically abnormal liver with complications in other organs. Most of such liver abnormality cases are not survive, as liver function becomes essential. The prevalence of liver malformations in CS18 and CS21 in the intrauterine population of externally normal embryos is approximately 1.7%. The present study is the first step toward the elucidation of the latent abnormalities resulting in spontaneous abortion in externally normal embryos. Anat Rec, 299:8–24, 2016.
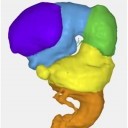
Shiraishi N, Katayama A, Nakashima T, Shiraki N, Yamada S, Uwabe C, Kose K, Takakuwa T, 3D model related to the publication: Morphology of the human embryonic brain and ventricles, MorphoMuseuM 1 (3)-e3. doi: 10.18563/m3.1.3.e3. [OpenAccess]