


 平成29年度 新学術領域研究「多元計算解剖学」シンポジウム(4.21(金)10時〜@名大)
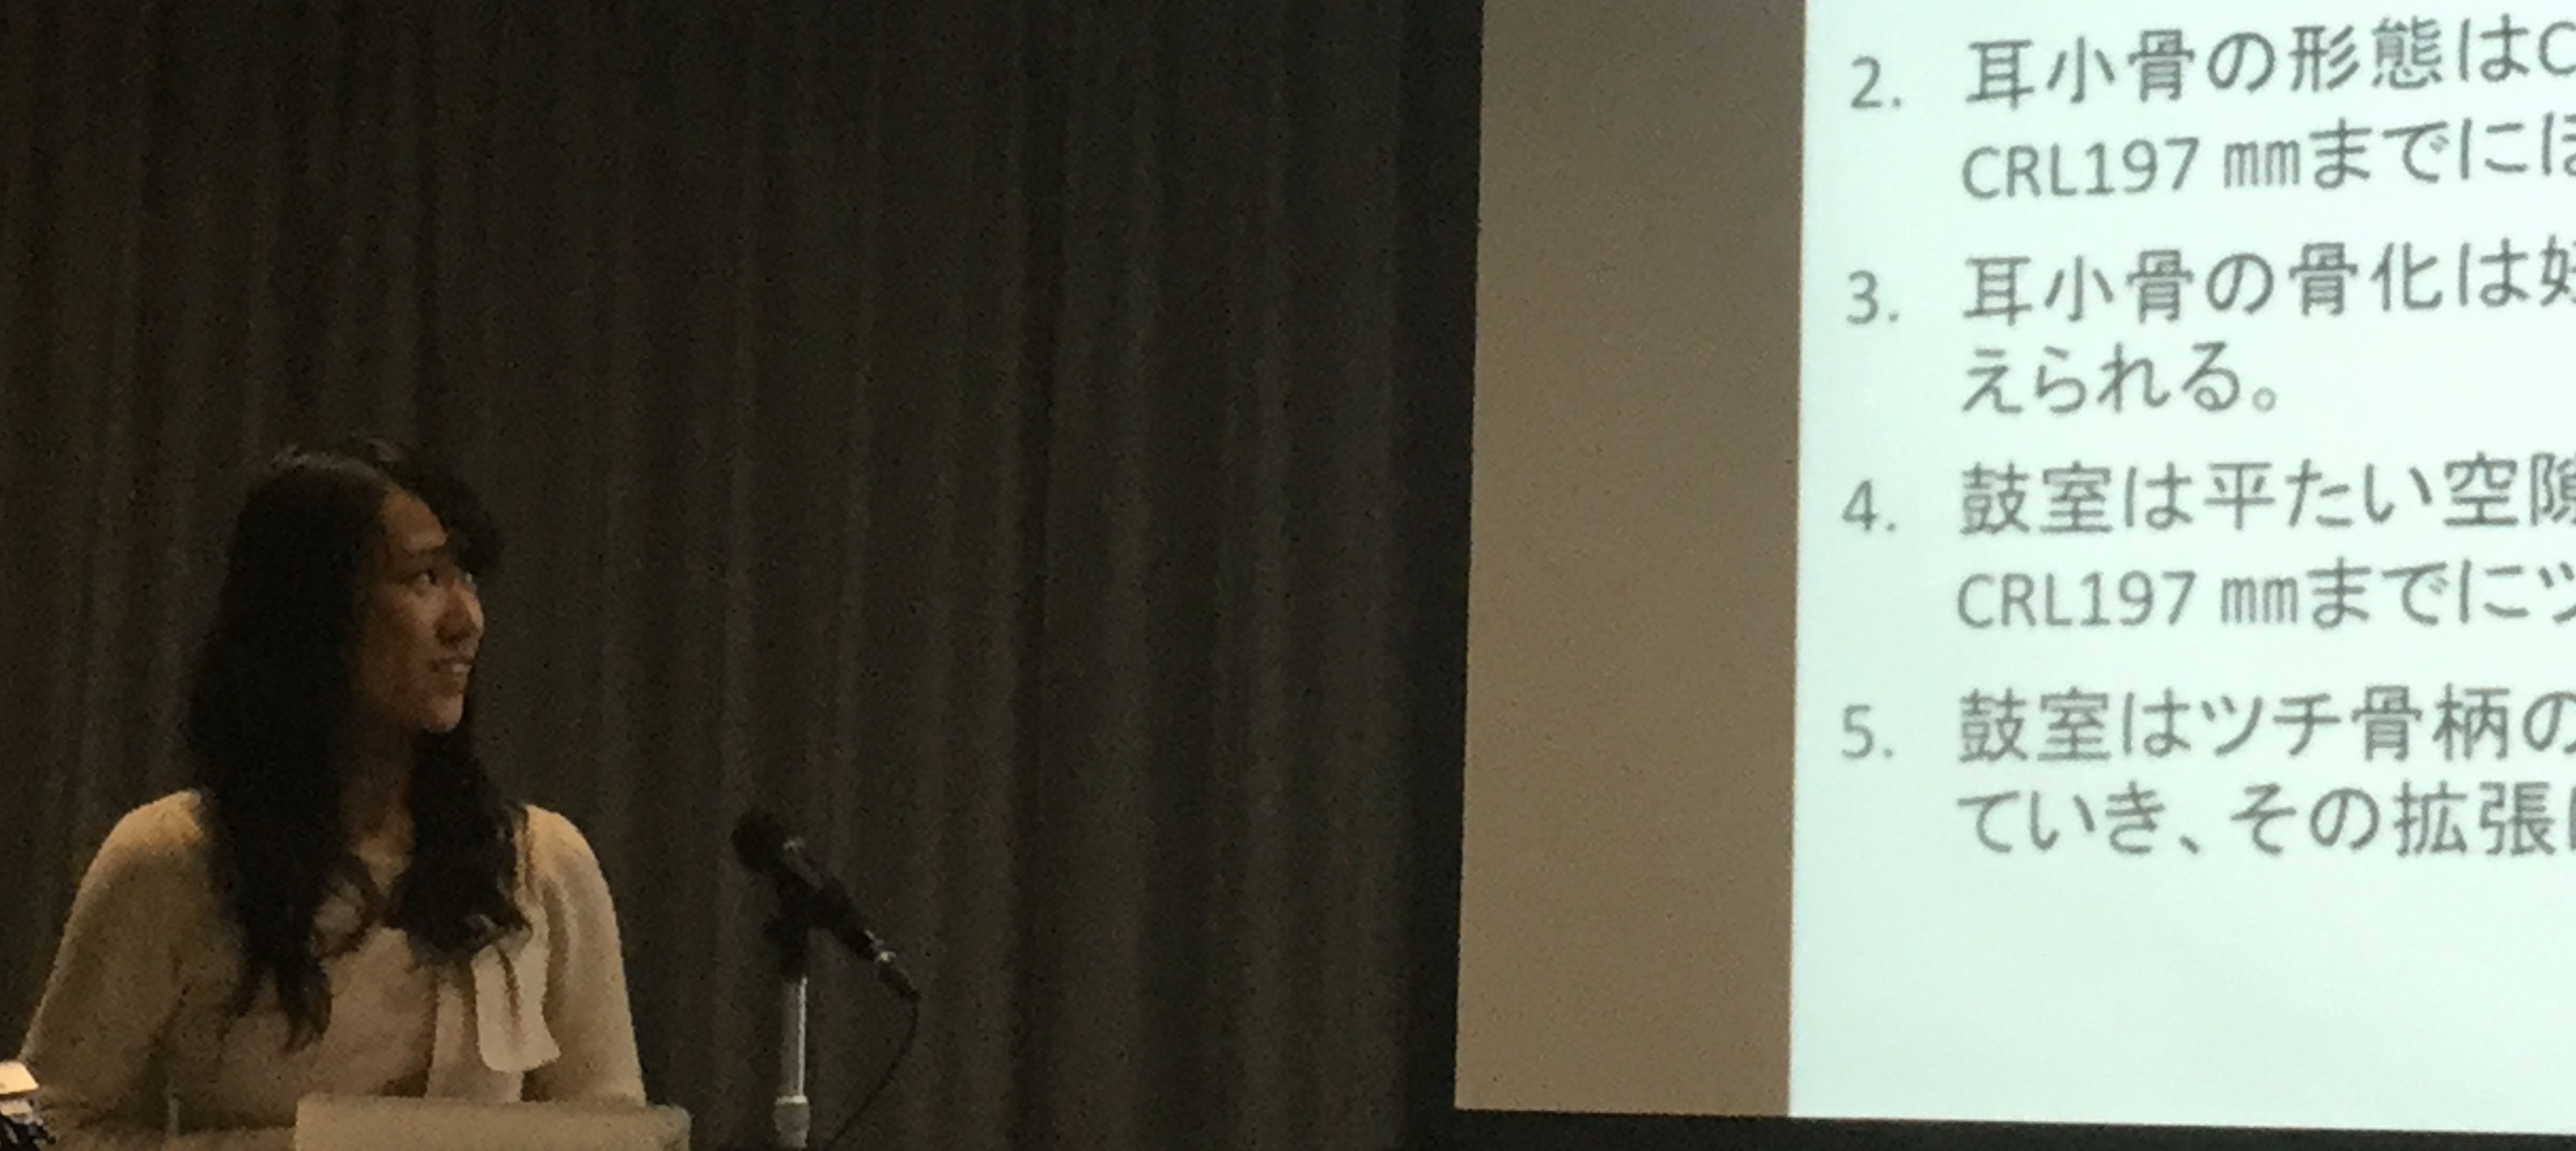
高桑は、スポーツ実習、細胞組織学実習等、終日実習をする日程になっていましたので、修士2年石山さんが代わりに発表しました。
石山さん重責をご苦労様でした。
|
||||
  |
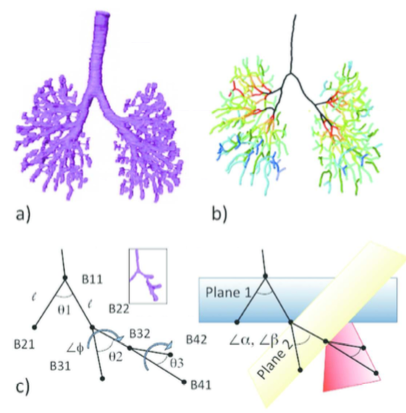
石山さん重責をご苦労様でした。 新学術領域研究「多元計算解剖学」第3回 国際シンポジウム(2017.3.8-9,奈良県文化会館) で発表しました。 A01-KB004 Three-dimensional Analysis of the Bronchial Branching in Human Embryonic Stages – Progress Overview FY2016 日本語
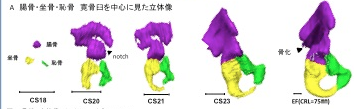 奥村さんの卒業研究がPLoS Oneに受諾されました。 ヒトの骨格形成は、保存しやすく、レントゲンでの解析が可能な骨化中、骨化後の解析がほとんどで、軟骨形成期の解析はほとんどされていません。今回、骨盤の軟骨形成期に着目し解析を進めました。
28. Okumura M, Ishikawa A, Aoyama T, Yamada S, Uwabe C, Imai H, Matsuda T, Yoneyama A, Takeda T, Takakuwa T, Cartilage Formation in the Pelvic Skeleton during the Embryonic and Early-Fetal Period, PLoS One 12(4): e0173852. https://doi.org/10.1371/journal. pone.0173852 [Open Access] Abstract The pelvic skeleton is formed via endochondral ossification. However, it is not known how the normal cartilage is formed before ossification occurs. Furthermore, the overall timeline of cartilage formation and the morphology of the cartilage in the pelvis are unclear. In this study, cartilage formation in the pelvic skeletons of 25 human fetuses (crown-rump length [CRL] = 11.9–75.0 mm) was observed using phase-contrast computed tomography and 7T magnetic resonance imaging. The chondrification center of the ilium, ischium, and pubis first appeared simultaneously at Carnegie stage (CS) 18, was located around the acetabulum, and grew radially in the later stage. The iliac crest formed at CS20 while the iliac body’s central part remained chondrified. The iliac body formed a discoid at CS22. The growth rate was greater in the ilium than in the sacrum-coccyx, pubis, and ischium. Connection and articulation formed in a limited period, while the sacroiliac joint formed at CS21. The articulation of the pubic symphysis, connection of the articular column in the sacrum, and Y-shape connection of the three parts of the hip bones to the acetabulum were observed at CS23; the connection of the ischium and pubic ramus was observed at the early-fetal stage. Furthermore, the degree of connection at the center of the sacrum varied among samples. Most of the pelvimetry data showed a high correlation with CRL. The transverse and antero-posterior lengths of the pelvic inlet of the lesser pelvis varied among samples (R2 = 0.11). The subpubic angle also varied (65–90°) and was not correlated with CRL (R2 = 0.22). Moreover, cartilaginous structure formation appeared to influence bone structure. This study provides valuable information regarding the morphogenesis of the pelvic structure. 2016年度の修士学位論文発表会が行われました(2/8-2/9). ヒト胚子期における気管支分岐形成の三次元的解析 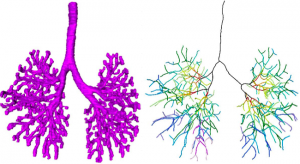 村中くんが下記の内容で発表しました。持参したコンピュータが会場のプロジェクターと繋がらず、コンピュータを急遽替えたため、用意したMovieが動かなかったり、改行がずれたりしましたが、内容には多くの方が興味を持っていただけました。良い発表であったと思います。 【背景】呼吸器の発生はCarnegie Stage(CS)12頃に始まり、生後数年まで発達が続く。器官形成期における組織学的な研究は多く報告されているが3次元的な検討は行われていない。 【対象と方法】京都大学大学院医学研究科附属先天異常標本解析センター所有のCS13~CS22のヒト胚子から得られた立体情報計36個体を対象とした。用いた個体はいずれも明らかな外表奇形、呼吸器の異常を伴っていない。1) 位相CT画像とEFICの画像情報をもとに気管支の立体像を作成しCSごとのヒト気管支の形成過程を観察した。気管支樹を作成し2) Metzgerらが提唱したマウス気管支の分岐patternに基づいた定性的検討、3) 気管支単位の角度計測をもとに数理的な検討、を行った。 【結果】1)形成過程の観察:CS13で左右の一次気管支芽が形成され、CS16で二次気管支芽が形成された。CS20ですべての区域気管支が観察された。一次気管支芽はCS13~CS16までは気管に対して背側方向に伸長し、CS17以降では腹側に伸長した。CSが進むにつれて気管支樹の最大分岐数が増加し、CS22で最大15分岐の気管支が観察された。各葉別の最大分岐数は、葉気管支を基準(第一分岐)とすると、多い順に右下葉、左下葉、左上葉、右上葉、右中葉だった。 2)マウス気管支の分岐patternに基づいたヒト気管支の定性的解析:k番目の分岐がDomain branchingの場合、k+1番目の分岐はDomain branching、Planar bifurcation、Orthogonal bifurcationのいずれも観察されたが、分岐patternがPlanar bifurcation、Orthogonal bifurcationである分岐は最も末梢の分岐のみに観察された。Orthogonal bifurcationの分岐において回転角が約90°の分岐と約45°の分岐が見られ、約90°の回転角の分岐の方が多いものの、約45°の回転角の分岐も一定数見られた。 3)気管支の数理的解析:Symmetric patternは主に末梢側で見られ、Asymmetric patternは中枢側と末梢側のどちらにも見られ、明瞭な分布の差はなかった。Symmetric patternはMetzgerらのPlanar bifurcationとOrthogonal bifurcationと類似点が見られた。Asymmetric patternはMetzgerらが定義したpatternに類似するものはなかった。 【結論】ヒト胚子期のCSごとの気管支の発生過程を形態学的、定性的、定量的に明らかにした。気管支の正常発生を知ることで異常個体の解析に応用できる可能性がある。 44. Fujii S, Muranaka T, Matsubayash J, Yamada S, Yoneyama A, Takakuwa T. The bronchial tree of the human embryo: an analysis of variations in the bronchial segments. J Anat 2020, 237, 311-322. doi: 10.1111/joa.13199. 48. Fujii S, Muranaka T, Matsubayashi J, Yamada S, Yoneyama A, Takakuwa T. Bronchial tree of the human embryo: categorization of the branching mode as monopodial and dipodial, PLoS One 16; e0245558, 2021, https://doi.org/10.1371/journal.pone.0245558
質疑応答も含め大変よくできました。晴れて卒業です。
ヒト胚子期~胎児期初期の大腿骨、髄腔の形態形成 鈴木裕子 ヒト胚子期後期におけるWillis輪の形態の多様性 古市華菜 高解像度MRI・DTIを用いたヒト胎児心筋の走行 西谷早織 ヒト胎児期初期~中期における中耳形成の三次元的解析 大槻咲愛 ヒト胚子期、胎児期初期における上気道、口腔の形態形成 尾脇なつみ
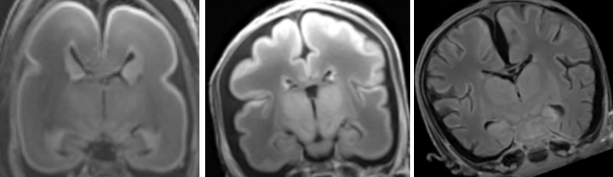 吉田さんの卒論がCongenit Anomに掲載されました。胎児の脳溝形成の様子をGyrification Indexを用いて解析しました。また、同号の表紙に、論文のFigureが採用されました。
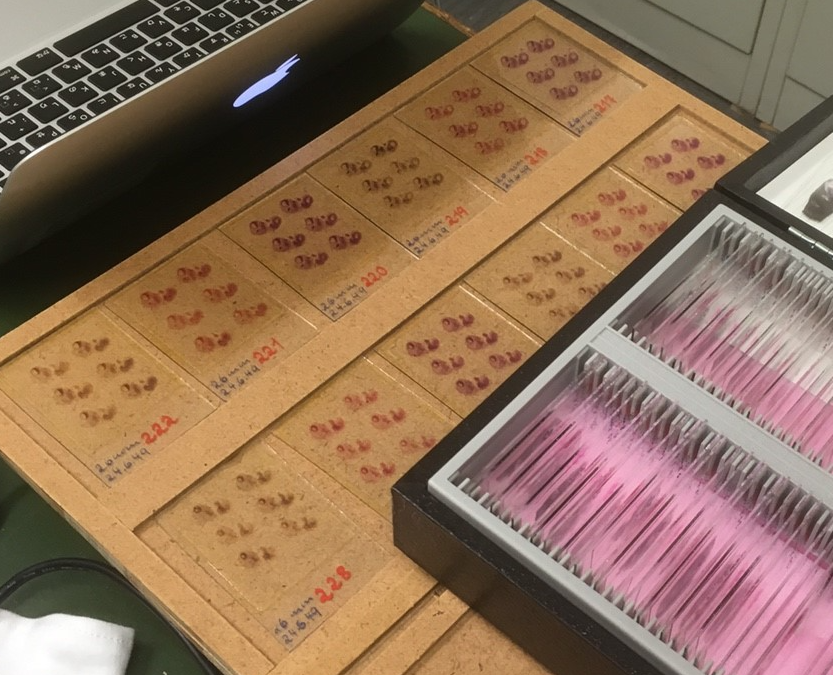
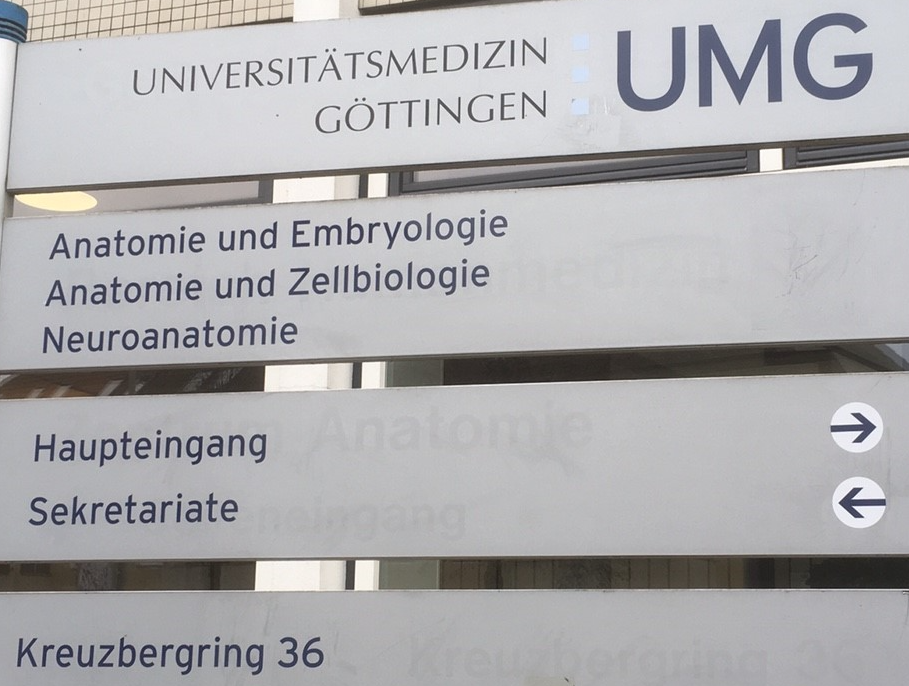
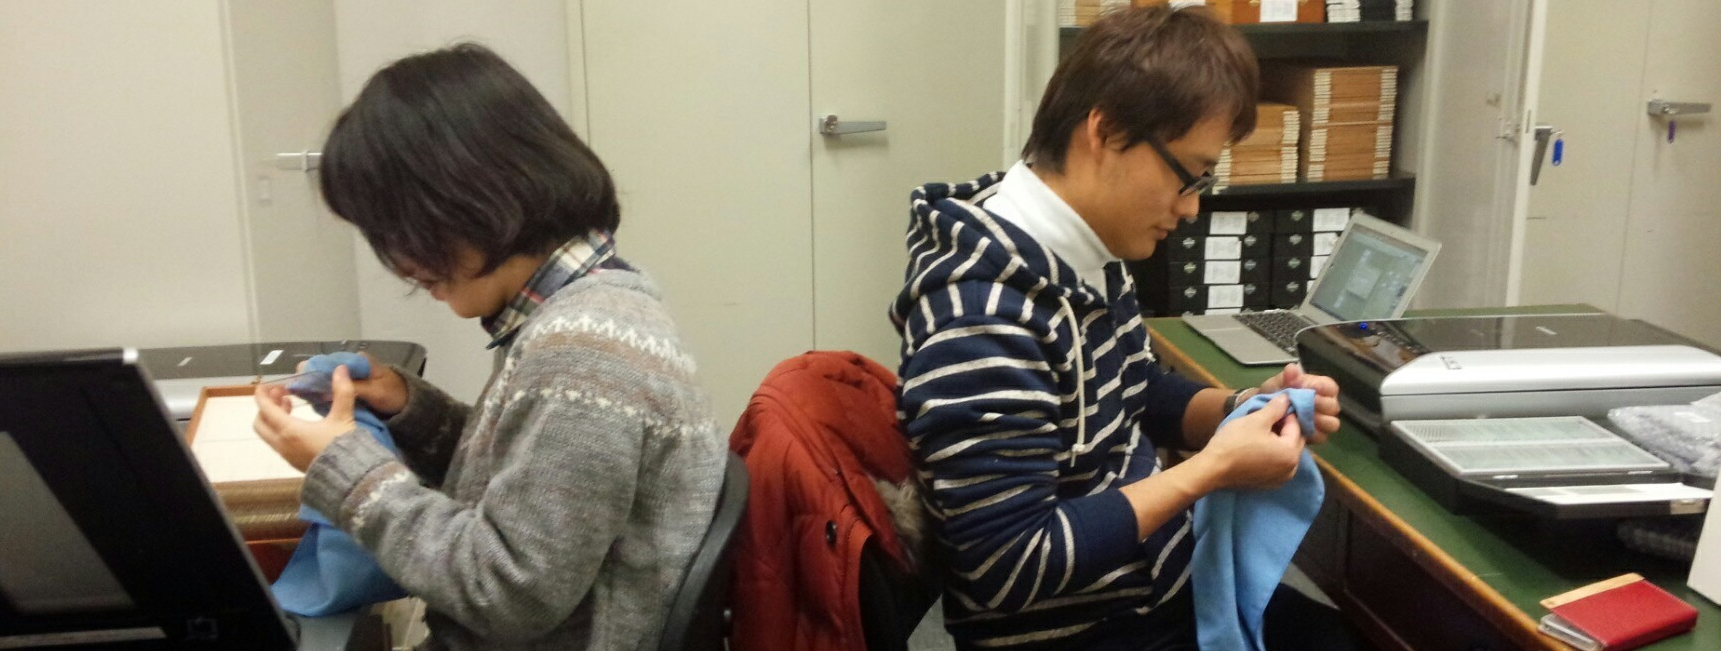
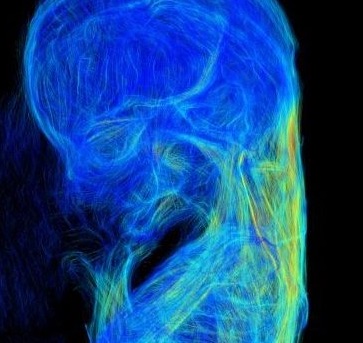
 Gyrification index (GI) of brain slices in a left lateral view of the brain in a 1409g fetus. The line graph above the brain shows the GI of each slice below it. The GI of the whole hemisphere changed in the rostro-caudal dimension. Several maxima of the GI curve appeared in relation to gross landmarks. Further details can be seen in the article by Yoshida et al. in this issue. 27. Yoshida R, Koichi Ishizu K, Yamada S, Chigako Uwabe C, Okada T, Togashi K, Takakuwa T, The dynamics of gyrification in the human cerebral cortex during development, Congenit Anom, 57 (1) 8-14, 2017, DOI: 10.1111/cga.12179, 10.1111/cga.12181 AbstractThis study quantitatively characterized cortical gyrus folding over human neocortical development by calculating the gyrification index (GI) in 22 human fetal specimens from 16 to 40 weeks with magnetic resonance imaging data. GI values remained constant at approximately 1.0 until the fetal specimens reached 500 g body weight and 200 mm crown-rump length (CRL), respectively, and then increased in correlation with the body weight and CRL. The rostrocaudal GI distribution in the cerebral cortex revealed a correspondence of GI peaks with indentations of early-generated primary sulci at 21 weeks of gestation and more frequently increased GI values in the parieto-occipital region than in the fronto-temporal region at 31 and 40 weeks of gestation. These results provide a quantitative reference set for gyrification in normal human cortical development, which may help reveal the mechanism of neurodevelopmental disorders. 12/5〜16の2週間、修士村中くん、石山さんが、先天研の方々とともにGöttingen大学を訪問しました。 Blechschmidt collectionという有名なヒト胚子コレクションに収められているガラススライド標本をデジタル画像に収めて来ました。今後、研究に活用する予定です。
 本研究室で行われているヒト胚子・胎児研究についてまとめた総説がAnatomical Recに掲載されました。 幅広い発達期間をカバーする大規模で高解像度なデジタルデータセットの確立し、そのメリットを活かした研究展開を示しました。デジタルデータのメリット、それを活かした展開として
器官形成時の動的で複雑なプロセスの解析、正確な形態学的データの提供への寄与が期待されます。 30. Takakuwa T, 3D analysis of human embryos and fetuses using digitized datasets from the Kyoto Collection, Anat Rec 2018, 301,960-969 doi: 10.1002/ar.23784 (英文で読む) ABSTRACTThree-dimensional (3D) analysis of the human embryonic and early-fetal period has been performed using digitized datasets obtained from the Kyoto Collection, in which the digital datasets play a primary role in research. Datasets include magnetic resonance imaging (MRI) acquired with 1.5 T, 2.35 T, and 7 T magnet systems, phase-contrast X-ray computed tomography (CT), and digitized histological serial sections. Large, high-resolution datasets covering a broad range of developmental periods obtained with various methods of acquisition are key elements for the studies. The digital data have gross merits that enabled us to develop various analysis. Digital data analysis accelerated the speed of morphological observations using precise and improved methods by providing a suitable plane for a morphometric analysis from staged human embryos. Morphometric data are useful for quantitatively evaluating and demonstrating the features of development and for screening abnormal samples, which may be suggestive in the pathogenesis of congenital malformations. Morphometric data are also valuable for comparing sonographic data in a process known as “sonoembryology.” The 3D coordinates of anatomical landmarks may be useful tools for analyzing the positional change of interesting landmarks and their relationships during development. Several dynamic events could be explained by differential growth using 3D coordinates. Moreover, 3D coordinates can be utilized in mathematical analysis as well as statistical analysis. The 3D analysis in our study may serve to provide accurate morphologic data, including the dynamics of embryonic structures related to developmental stages, which is required for insights into the dynamic and complex processes occurring during organogenesis. Anat Rec, 301:960–969, 2018. |
|||